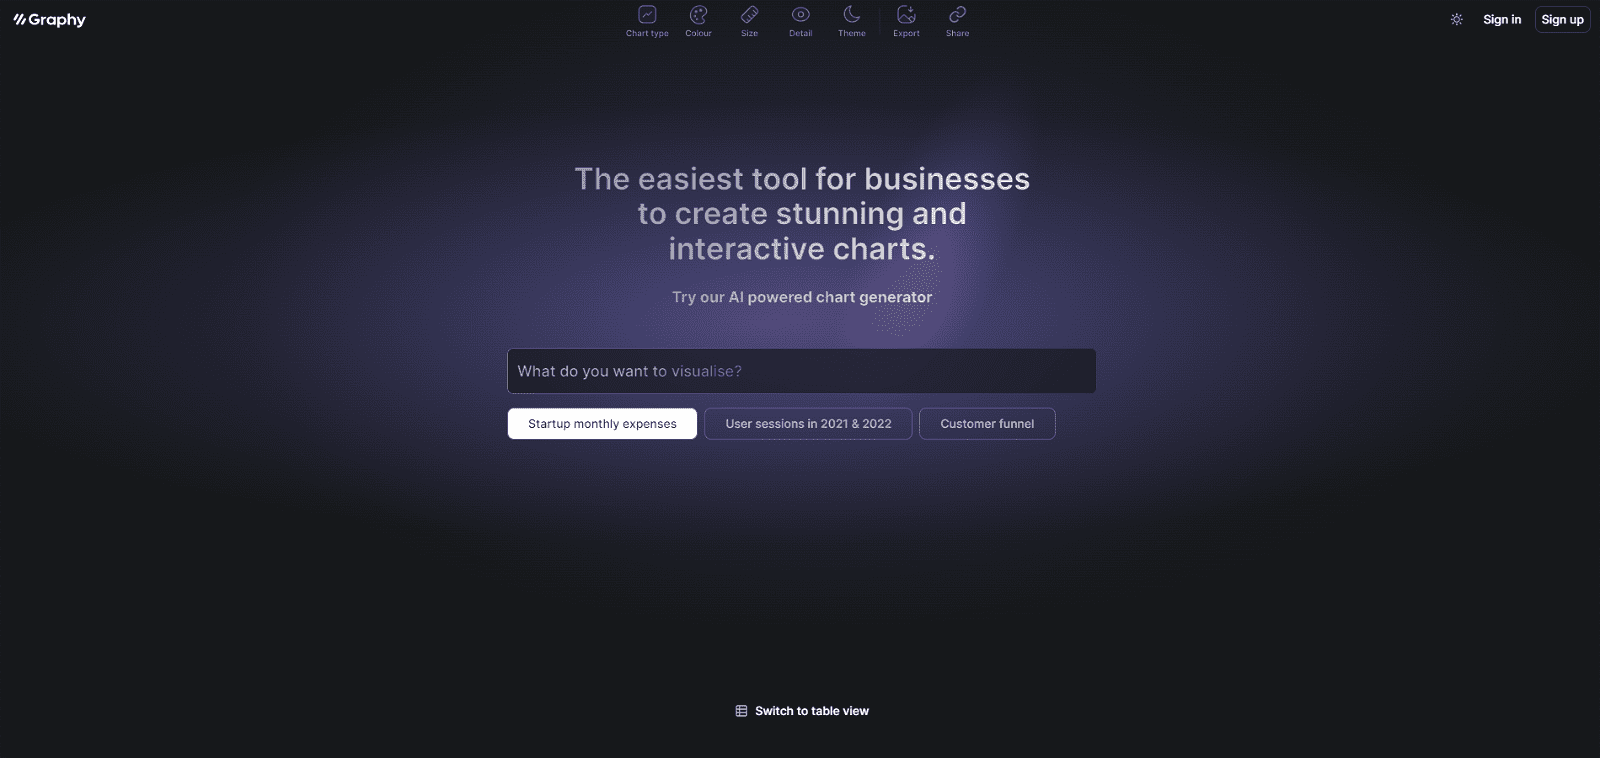
Graphy is a free chart-maker tool designed to help businesses effortlessly create sleek and interactive data visualizations. With the aid of artificial intelligence, users can generate stunning charts without requiring advanced technical skills.
These charts are easily embeddable into various platforms, including Notion and other preferred applications, enabling businesses to present their data in visually appealing and engaging ways.
Offering a variety of chart options, Graphy allows users to showcase different types of data, such as startup monthly expenses, user sessions within specific time frames, and customer funnel analysis.
Users also have the flexibility to switch to a table view for a more concise representation of their data. Graphy prioritizes user convenience by providing a simple and intuitive interface, catering to individuals with varying levels of technical expertise.
This allows businesses to save time and resources that would otherwise be spent on manual chart creation or hiring specialized personnel. Moreover, the AI-powered capabilities of the tool assist users in generating charts quickly and accurately.
Overall, Graphy is an efficient and user-friendly tool that empowers businesses to create visually impactful data visualizations. By leveraging its features, businesses can effectively present their data, gain insights, and make informed decisions.
More details about Graphy app
How do I switch to a table view in Graphy?
Switching to a table view in Graphy is seamless, with a dedicated option within the tool allowing you to easily transition from a chart view to a more concise table representation of your data.
Can I use Graphy without advanced technical skills?
Absolutely, Graphy is designed for accessibility and does not require advanced technical skills. Its user-friendly interface and AI-powered capabilities enable anyone to create visually appealing charts effortlessly.
How do I use Graphy for business?
To utilize Graphy for business, simply input your data into the tool, select a suitable chart type from a range of options, and allow the AI to generate your chart. You can then embed the charts into your preferred applications for sharing and presentation purposes.
What are the key features of Graphy?
Key features of Graphy include a variety of chart options, AI-powered rapid chart generation, an option to switch to table view, the ability to embed charts into platforms like Notion, and an intuitive, user-friendly interface.