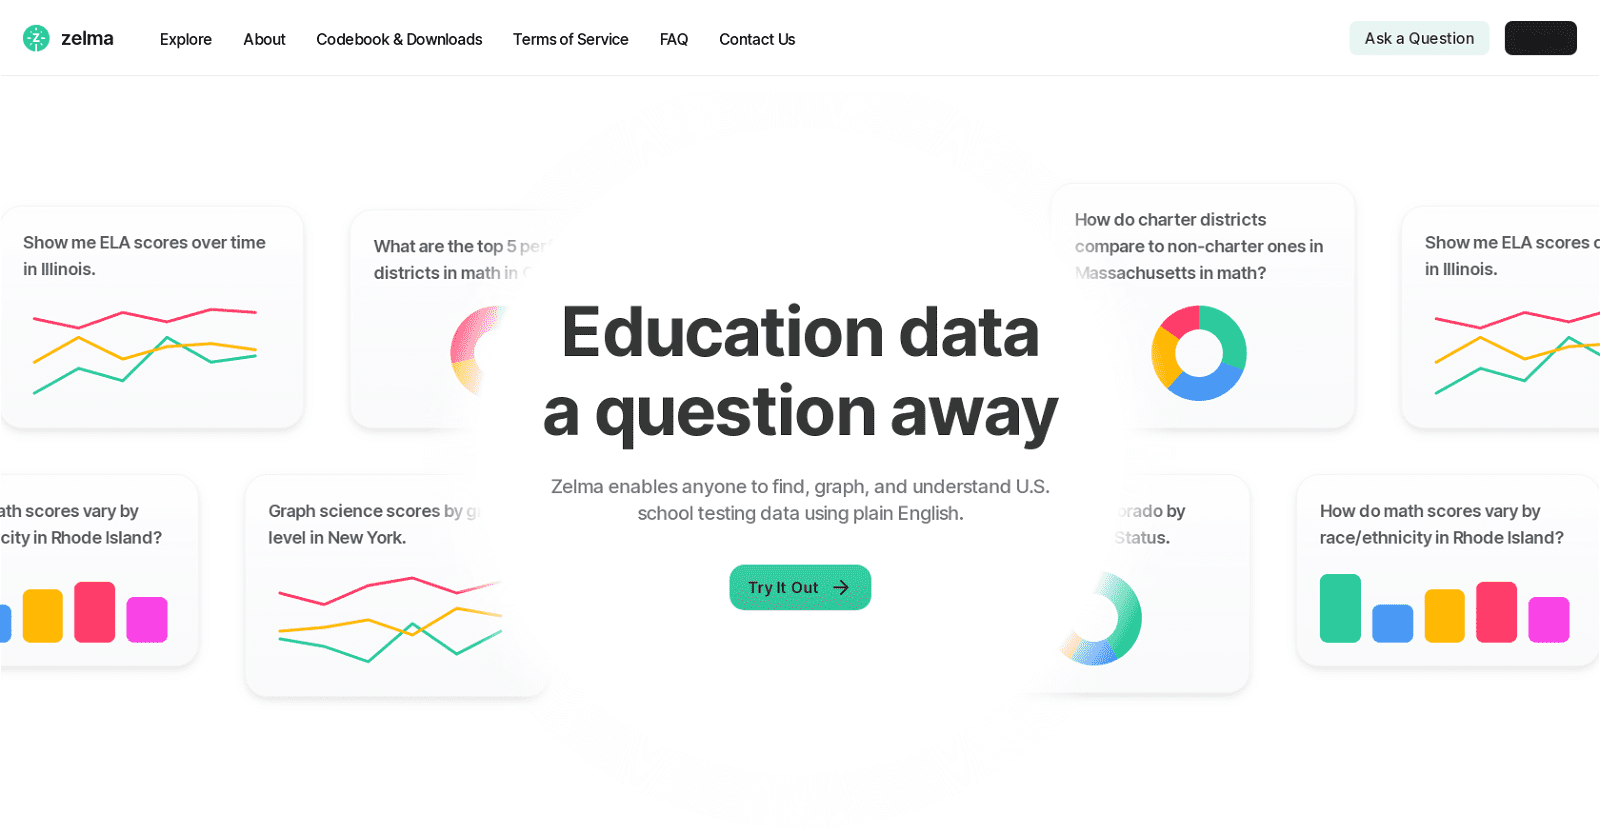
Zelma is an AI-powered research assistant specializing in U.S. school testing data, offering a wide array of applications for educators, policymakers, and researchers. Through simple language queries, users can explore, filter, and comprehend a comprehensive dataset spanning various parameters.
The tool seamlessly translates plain English questions into data-driven insights, empowering users to compare scores between states and school districts, analyze score trends over time, and discern patterns based on demographic identifiers like race/ethnicity.
Zelma enhances data comprehension by visualizing datasets with graphs and tables, simplifying the understanding of complex educational statistics and trends. Its user-friendly design allows users to ask questions via plain text, with the AI processing the data and returning answers in descriptive formats, tables, or graphs.
This accessibility eliminates the need for advanced technical expertise in data analysis. Furthermore, Zelma facilitates data sharing through tweet links or embedding results, graphs, and tables into blogs or other web platforms. This capability ensures effective communication of insights to a broader audience, making Zelma a versatile tool for data-driven conversations and decision-making.
More details about Zelma
What is the purpose of Zelma’s data sharing feature?
The purpose of Zelma’s data sharing feature is to facilitate broader dissemination of educational data insights. By allowing users to share their findings via tweet links or embed results, graphs, and tables into various web platforms, Zelma promotes wider discussion and engagement among educators, policymakers, researchers, and the general public.
How user-friendly is Zelma’s interface?
Zelma boasts a highly user-friendly interface, enabling users to input questions through simple text queries. The platform then delivers responses in descriptive formats, tables, or graphs, ensuring accessibility and ease of use for individuals of varying technical expertise.
How does Zelma visualize data?
Zelma visualizes data by generating graphs or tables based on the user’s data inquiry. This visualization method not only organizes the comprehensive educational data but also enhances comprehension by presenting complex statistical information in an accessible format.
Can Zelma compare scores between different states and school districts?
Certainly. Zelma is equipped to compare scores between different states and school districts. Users can input plain English questions specifying the states and/or school districts for comparison, and Zelma will provide data-driven insights that compare the relevant scores.