Turbular is an AI analytics platform primarily designed to assist data scientists, analysts and business users in making informed decisions backed by data. It offers multiple resources, including visual dashboards, report generation, and predictive analytics, to provide deeper insights into business data.
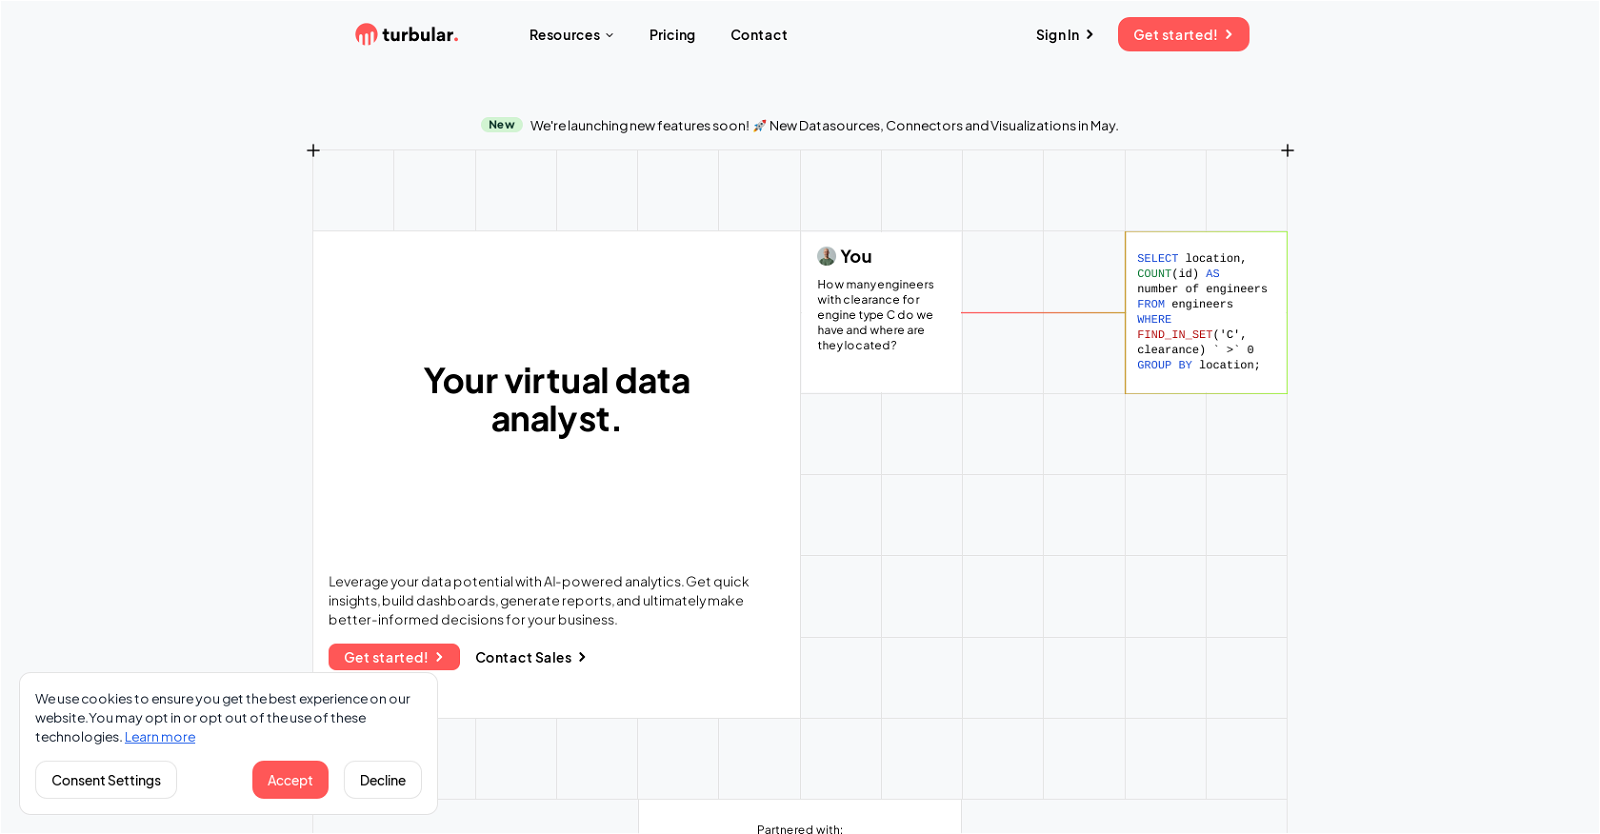
A major feature of Turbular is its AI-powered data analysis capability. Users can interact with the platform using natural language, enabling them to ask direct queries to the system to gather data insights.
This eases the process of extracting meaningful data and reduces the time typically spent on data extraction. The platform also offers quick integration capabilities with various data sources such as databases, Excel files, and cloud platforms like BigQuery.
More details about Turbular
Can Turbular assist in making better-informed decisions?
Yes, by offering AI-powered data analyses, Turbular assists users in making better-informed decisions. It enables users to gain deep insights into business data, which is critical in effective decision-making processes.
What kind of assistance does Turbular offer for learning how to connect to different databases?
Turbular provides a range of tutorials and guides designed to help users understand how to connect to different databases and utilise the AI Data Analyst effectively. This includes how-to guides on connecting to BigQuery, calculating Customer Lifetime Value, and more.
How does Turbular ensure data is presented in a meaningful way?
Turbular implements a combination of AI-powered data analysis and visually appealing data representations, ensuring that data is presented in a meaningful and digestible manner. Turbular allows users to create a variety of visualizations to understand their data more efficiently and facilitate informed decision-making.
What type of visualizations can be created using Turbular?
With Turbular, users can create a variety of visualizations such as charts, graphs, or dashboards. The platform’s easy-to-use drag-and-drop interface assists users in creating these visualizations to amplify the comprehension of extracted insights.