ChatViz is a tool engineered to enhance data visualization capabilities through ChatGPT. It features two primary functions. The first is an SQL translator, which swiftly generates corresponding SQL queries based on user input commands. This simplifies the interaction between users and their SQL databases, reducing the need for extensive SQL knowledge. The second function is an automated chart generator that recommends the most suitable charts for a given dataset. This streamlines the selection of the optimal data representation format. Utilizing ChatViz can enhance user experience during data visualization and expedite the implementation process. Addressing the common challenge of dashboard complexity, it introduces a novel approach to visualizing data. The tool includes a customizable ChatViz widget. To utilize ChatViz, users must configure their SQL schema and set up a webhook for communication. Once configured, ChatViz visualizes the output data from the webhook, aiming to reduce development time by automating the data visualization process.
More details about ChatViz
What dataset requirements does ChatViz’s automated chart generator have?
The specific dataset requirements for ChatViz’s automated chart generator are not explicitly stated on their website.
How does ChatViz simplify interaction with SQL databases?
ChatViz streamlines interaction with SQL databases through its SQL translator feature. By promptly generating SQL queries based on user inputs, it reduces the need for extensive SQL knowledge, making SQL database interaction more accessible.
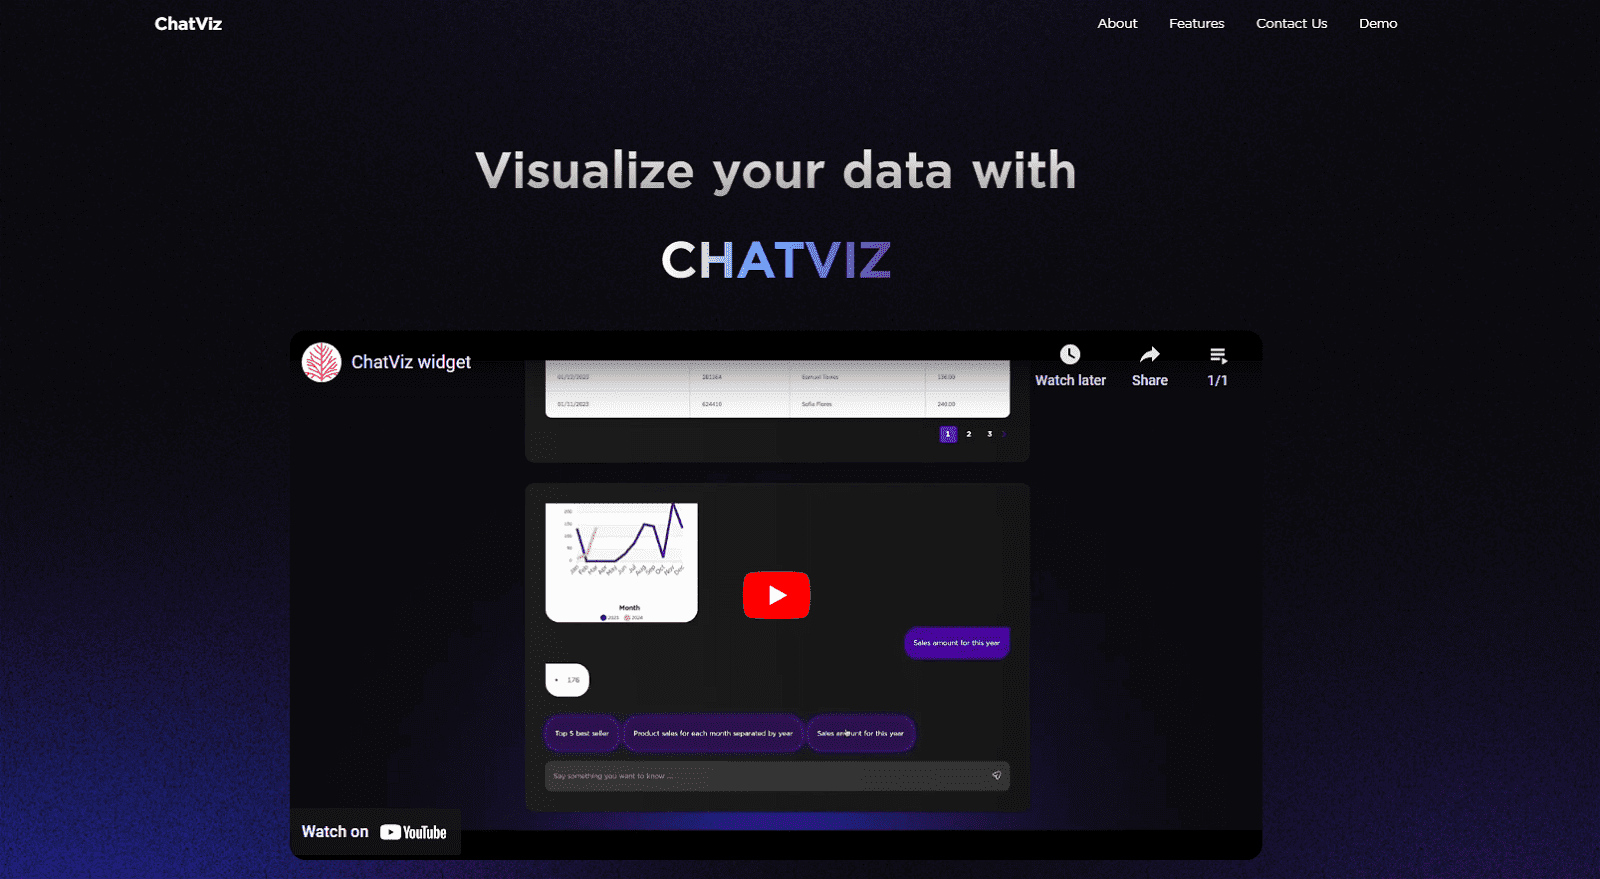
How does the ChatViz widget function?
The ChatViz widget is a customizable tool designed to visualize data output from a webhook. After configuring your SQL schema to ChatViz and setting up the webhook connection, the widget displays the visualized data.
What’s the advantage of using the ChatViz widget for data visualization?
The advantage of using the ChatViz widget for data visualization is its automation capability. By automating SQL query generation and chart selection, it simplifies and expedites the data visualization process, ultimately saving development time.