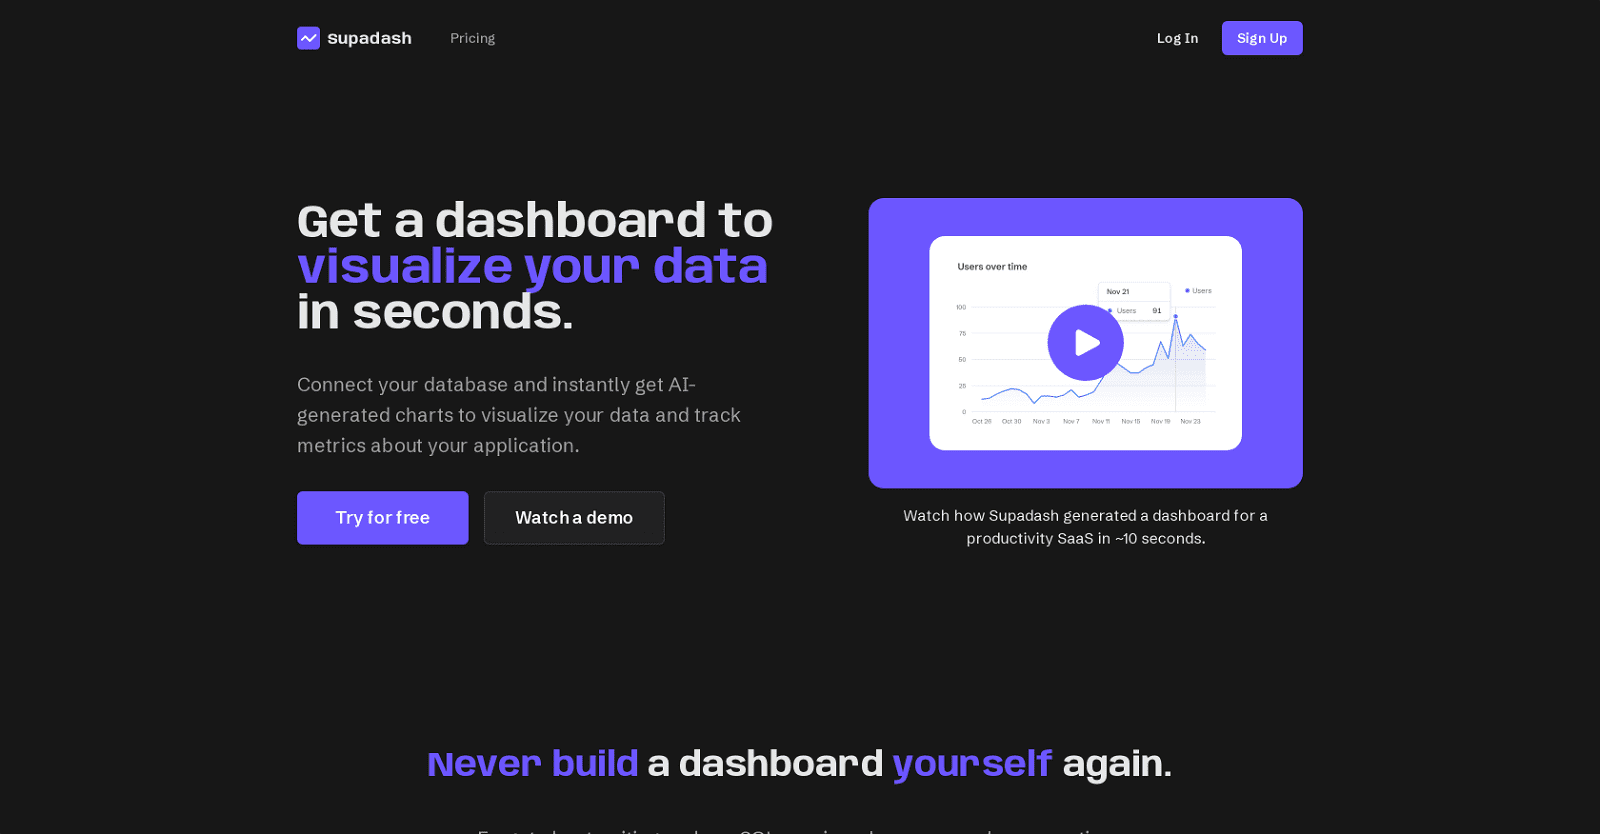
Supadash is a game-changing tool engineered to streamline the data visualization process by automating the creation of data dashboards. It empowers users to effortlessly connect their databases and instantly generates dynamic charts, enabling them to comprehend and analyze their data with ease.
By leveraging Supadash, the cumbersome task of manually coding and querying databases for dashboard creation becomes obsolete. The AI-driven system embedded within Supadash swiftly constructs the dashboard in a matter of seconds, freeing users from the complexities of traditional data visualization methods.
Supadash accommodates various data sources, including PostgreSQL databases and REST APIs, with plans to expand compatibility to additional sources in future updates. Once connected, the tool efficiently processes and translates the data into insightful charts and visualizations.
This functionality not only enables users to identify important metrics but also facilitates the extraction of invaluable business insights from their data, all in a seamless and efficient manner.
More details about Supadash
Can I watch a demo of Supadash before using it?
Yes, Supadash’s website offers a demo of the product in use. The demo offers a visual representation of the dashboard generation process and features of the platform.
How does Supadash simplify data visualization?
Supadash’s automatic data dashboard creation greatly simplifies data visualization. Its AI-driven technology does away with the need for manual SQL query writing and coding in dashboard design. It reduces the complexity and time required for data visualization jobs by rapidly generating charts for viewing user data.
Can I connect my own database to Supadash?
It is possible for users to connect their own databases to Supadash. After the database connection, it rapidly creates charts to help customers properly visualize their data.
Can I sign up for Supadash?
Yes, users can register for the service through the “Sign Up” option on the Supadash website.