Amazon’s position as a global e-commerce titan remains undisputed, hosting a vast marketplace where 9.7 million sellers compete for sales and profitability. For aspiring entrepreneurs entering this dynamic platform, understanding the current landscape is crucial for success. With nearly 60% of all Amazon sales originating from third-party sellers, the potential for growth is immense. However, the environment is highly competitive; only a fraction, about 10%, of these sellers achieve annual earnings exceeding $100,000. This article delves into the essential Amazon seller statistics for 2024, providing critical insights into sales trends, revenue benchmarks, top-performing categories, and operational dynamics shaping the platform today. Understanding these figures is the first step towards navigating the complexities and maximizing the opportunities of selling on Amazon.
The Amazon Seller Landscape in 2024
As of 2024, the Amazon marketplace is home to a staggering 9.7 million registered sellers. However, the number actively listing and selling products is closer to 1.9 million. The platform continues to attract new entrants at a rapid pace. Since the beginning of 2024, approximately 839,900 new sellers have registered, averaging around 3,700 new sign-ups each day. Projections suggest that by the start of 2025, over 1.3 million additional sellers are expected to join the marketplace.
This massive seller base serves an equally large customer pool. Amazon boasts over 310 million active users globally, with a significant concentration in the United States, accounting for roughly 80% of the user base.
(Source: Helium10, Amazon)
Understanding Amazon Seller Types: 1P vs. 3P
The 9.7 million sellers on Amazon primarily fall into two categories: Third-Party (3P) sellers and First-Party (1P) vendors. First-party vendors operate on a wholesale model, selling their products directly to Amazon, which then resells them to consumers. Third-party sellers, conversely, list and sell their products directly to consumers on the Amazon marketplace, managing their own sales process.
Independent third-party sellers are the driving force behind a significant portion of Amazon’s sales volume. Currently, 68% of sellers identify as 3P sellers, while 40% operate as 1P vendors. Notably, 9% engage in both models.
| Type of Sellers on Amazon | % of sellers |
|---|---|
| 3P Sellers | 68% |
| 1P Sellers | 40% |
| Both | 9% |
In 2023 alone, third-party sellers in the US moved over 4.5 billion items, translating to an average of 8,600 products sold every minute. Beyond individual entrepreneurs, small businesses, established enterprise brands, and retailers also leverage the platform. Brand owners, in particular, saw their sales on Amazon grow by over 22% in 2023, underscoring the platform’s value for brand building and expansion.
Amazon Seller Sales Performance and Revenue Insights
On average, Amazon sellers generated annual sales exceeding $230,000 in 2024. Impressively, over 60,000 sellers surpassed the $1 million mark in annual sales, highlighting the platform’s potential for significant revenue generation.
Average Monthly Sales
Selling on Amazon presents a viable income stream, often exceeding typical side hustles. Approximately 19% of small and medium-sized business (SMB) sellers report average monthly sales over $10,000. For larger enterprise brands, this figure jumps dramatically, with 78% achieving monthly sales exceeding $50,000. Overall, more than half (52%) of all Amazon sellers generate sales above $1,000 per month.
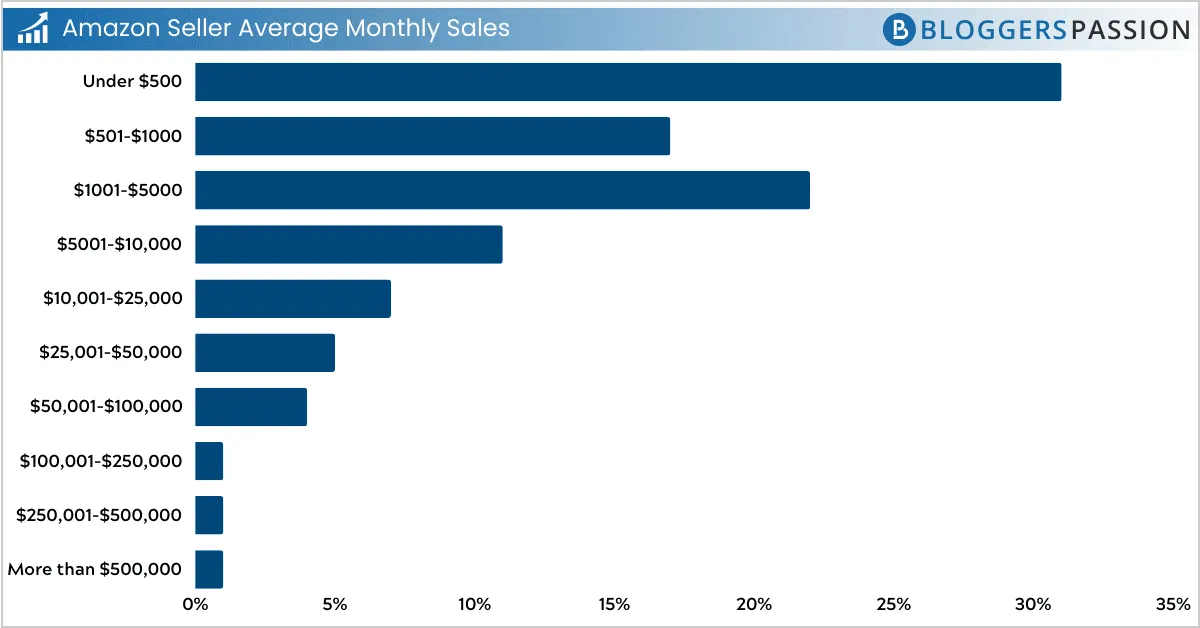 Chart showing average monthly sales distribution among Amazon sellers and SMBs in 2024, highlighting revenue tiers.
Here’s a breakdown of monthly sales distribution among Amazon sellers and SMBs:
| Monthly sales | Amazon sellers and SMBs |
|---|---|
| Under $500 | 31% |
| $501-$1000 | 17% |
| $1001-$5000 | 22% |
| $5001-$10,000 | 11% |
| $10,001-$25,000 | 7% |
| $25,001-$50,000 | 5% |
| $50,001-$100,000 | 4% |
| $100,001-$250,000 | 1% |
| $250,001-$500,000 | 1% |
| More than $500,000 | 1% |
(Source: Jungle Scout Study)
Seller Performance and Profitability
Profitability is a key metric for Amazon sellers. According to Jungle Scout, over 44% of Amazon sellers achieve profit margins greater than 15%. Furthermore, 57% of sellers and SMBs report net profit margins exceeding 10%.
The distribution of gross profit margins among Amazon sellers is as follows:
| Amazon Profit Margins | Amazon Sellers and SMB’s |
|---|---|
| ~1-5% | 12% |
| 6-10% | 16% |
| 11-15% | 13% |
| 16-20% | 15% |
| 21-25% | 15% |
| 26-50% | 13% |
| 51-100% | 1% |
| Not Profitable | 13% |
(Source: Jungle Scout Study)
Regarding lifetime profits, around 30% of SMB sellers have earned over $50,000, with approximately 10% achieving lifetime profits between $100,000 and $500,000.
From a broader perspective, net sales generated from third-party seller services in Q1 2024 reached approximately $34.6 billion, representing a significant year-over-year growth of about 16%. This underscores the increasing contribution of third-party sellers to Amazon’s overall revenue.
Profile of an Amazon Seller: Demographics Deep Dive
Amazon’s seller community is diverse, comprising entrepreneurs from various backgrounds, locations, and age groups. Understanding these demographics provides context to the marketplace dynamics.
Amazon Sellers by Country
The United States hosts the largest concentration of Amazon sellers, accounting for 55% of the global total. The United Kingdom follows at a distant second with 7%.
| Country | % of all sellers |
|---|---|
| United States | 55% |
| United Kingdom | 7% |
| Canada | 6% |
| India | 5% |
| United States Territories | 3% |
| Nigeria | 2% |
| Spain | 2% |
| France | 2% |
| Pakistan | 2% |
| Other | 14% |
Within the US, California is home to the highest number of sellers, representing 18% of the domestic total.
(Source: Jungle Scout Study)
Amazon Sellers By Age
The age distribution of Amazon sellers skews towards younger demographics. The largest cohort falls within the 25-34 age bracket, making up 33% of all sellers. The 35-44 age group follows closely at 31%. Combined, sellers aged 25-44 represent a significant majority (64%) of the marketplace.
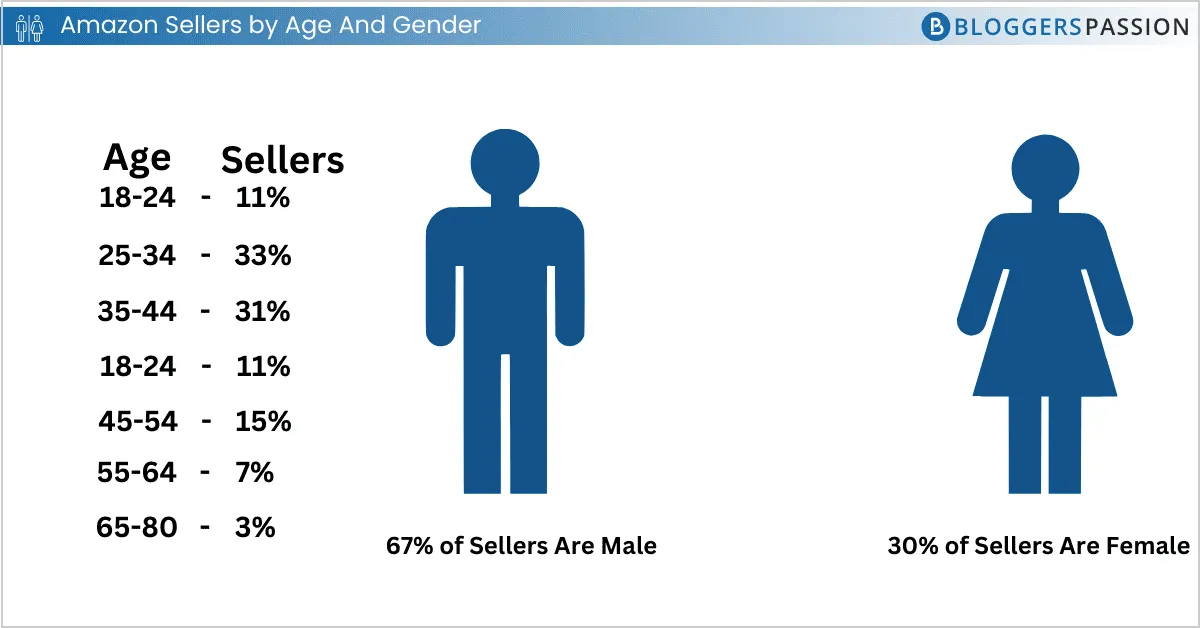 Infographic illustrating Amazon seller demographics by age groups and gender distribution for 2024.
| Age | % of all sellers |
|---|---|
| 18-24 | 11% |
| 25-34 | 33% |
| 35-44 | 31% |
| 45-54 | 15% |
| 55-64 | 7% |
| 65-80 | 3% |
(Source: Jungle Scout Study)
Amazon Sellers by Gender
Male sellers constitute the majority on the platform, representing 67% of the seller base. Female sellers account for 30%.
| Gender | % of sellers |
|---|---|
| Male | 67% |
| Female | 30% |
(Note: Numbers may not equal 100% due to rounding)
(Source: Jungle Scout Study)
Amazon Sellers by Education and Employment
Amazon sellers come from diverse educational and professional backgrounds.
Education Levels of Amazon Sellers
A large portion of Amazon sellers are well-educated. The most common level of educational attainment is a bachelor’s degree, held by 40% of sellers.
| Education Level | % of Sellers |
|---|---|
| Bachelor or equivalent | 40% |
| Master or equivalent | 26% |
| High school diploma/ secondary education/GED | 14% |
| Associate degree/post-secondary education | 11% |
| Doctoral or equivalent | 5% |
| No high school/ secondary education | 3% |
| Trade/technical/other | 2% |
(Source: Jungle Scout Study)
Employment Status of Amazon Sellers
Many Amazon sellers balance their e-commerce activities with other professional roles. Only 22% work exclusively on their e-commerce business. A significant portion, 52%, manage their Amazon store alongside other jobs or side hustles.
Here’s a breakdown of their employment status:
| Employment of the sellers | % of sellers |
|---|---|
| Employed full-time | 37% |
| Work exclusively on ecommerce business | 22% |
| self-employed/entrepreneur | 19% |
| Employed part-time (1-39 hours per week) | 14% |
| Student | 3% |
| Retired | 2% |
| Not employed, looking for work | 1% |
| Not currently employed | 1% |
| Disabled, not able to work | 1% |
(Source: Jungle Scout Study)
Dominant Amazon Business Models Explored
Sellers on Amazon employ various strategies to bring products to market. Six primary business models are prevalent:
| Amazon Business Model | Model Description | Amazon sellers using it |
|---|---|---|
| Private Label | Create own product label or brand | 54% |
| Wholesale | Buy overstock products directly from brands or distributors to sell on Amazon | 25% |
| Retail Arbitrage | Buy discounted products through retailers to sell on Amazon | 25% |
| Online Arbitrage | Buy discounted products online to sell on Amazon | 21% |
| Dropshipping | Buy products directed by a manufacturer who fulfills and ships the order | 19% |
| Handmade | Create/craft own products to sell on Amazon | 9% |
| Original Product | Invented and sells a completely original product | 4% |
Private Label is the most favored model, utilized by 54% of sellers. This involves creating and marketing products under their own brand. Wholesale (buying in bulk from established brands) and Retail Arbitrage (reselling discounted retail items) are also popular, each used by 25% of sellers. Online Arbitrage (reselling discounted online items) and Dropshipping follow closely.
(Source: Jungle Scout Study)
Fulfillment Strategies: FBA vs. FBM Usage
Amazon provides sellers with several options for handling order fulfillment and inventory management. The main methods are Fulfillment by Amazon (FBA) and Fulfillment by Merchant (FBM). Other options include Seller Fulfilled Prime (SFP) and Multi-Channel Fulfillment (MCF).
Data indicates a strong preference among sellers for FBA and FBM:
| Fulfillment Method | % of sellers using it |
|---|---|
| FBA | 82% |
| FBM | 34% |
| FBA Only | 64% |
| FBM Only | 14% |
| Both | 22% |
(Source: Jungle Scout Study)
Fulfillment by Amazon (FBA)
A vast majority, 82% of Amazon sellers and businesses, utilize FBA, with 64% relying on it exclusively. This popularity stems from its convenience and benefits. With FBA, sellers ship their inventory to Amazon’s fulfillment centers. Amazon then handles storage, picking, packing, shipping, customer service, and returns processing. A key advantage is access to Amazon’s Prime customer base and eligibility for Prime’s fast shipping options, which typically leads to a sales increase of 20-25% for sellers using FBA.
Fulfillment by Merchant (FBM)
Under the FBM model, sellers retain control over their entire fulfillment process, managing inventory storage, packing, shipping, and customer service themselves. This provides greater flexibility but requires more logistical effort. As of 2024, 34% of sellers use FBM, with 14% using it as their sole fulfillment method.
(Source: Jungle Scout Study)
Top Challenges Facing Amazon Sellers Today
While potentially lucrative, selling on Amazon presents numerous hurdles. For individual sellers and SMBs, obtaining customer reviews and conducting effective product research rank as the most significant challenges. For larger enterprise businesses, the primary concerns shift towards branding efforts and increasing market share against competitors.
Here are the top 10 business challenges reported by Amazon sellers in 2024:
- Getting customer reviews
- Product research
- Trying new marketing tactics
- Optimizing product listings
- Increasing market share
- Managing PPC advertising
- Finding a supplier
- Managing finances
- Managing inventory
- Branding the business/products
Beyond these operational challenges, rising costs represent a major concern across the board. More than a third of sellers expressed worries about increasing expenses related to advertising, shipping, and the cost of goods.
| Cost related concerns | % of sellers |
|---|---|
| Increasing ad costs | 38% |
| Increasing shipping costs | 37% |
| The increasing cost of goods | 35% |
| Rising Storage fees | 32% |
| Inflation | 29% |
| A recession | 23% |
These cost pressures are not isolated to sellers; they mirror broader economic trends, with 85% of consumers reporting that these factors have impacted their spending habits.
(Source: Jungle Scout Study)
Hot Product Categories and Sourcing Trends
The Home & Kitchen category remains the most popular and often most profitable segment for Amazon sellers. According to Jungle Scout’s report, 35% of sellers list products within this category.
Here are the leading product categories in 2024 and their year-over-year change in seller participation:
| Category | % of sellers | YoY change |
|---|---|---|
| Home & Kitchen | 35% | 6% |
| Beauty & Personal Care | 26% | 4% |
| Clothing, Shoes & Jewelry | 20% | 0% |
| Toys & Games | 18% | 13% |
| Health, Household & Baby Care | 17% | 0% |
| Baby | 16% | 7% |
| Electronics | 16% | -6% |
| Sports & Outdoors | 16% | 0% |
| Arts, Crafts & Sewing | 14% | -7% |
| Books | 14% | 17% |
(Source: Jungle Scout Study)
Amazon Product Sourcing
Regarding where sellers obtain their products, China continues to dominate the supply chain for Amazon businesses of all sizes. A significant 71% of U.S.-based sellers source their inventory from China. However, there’s a noticeable shift occurring. Over the past year, the percentage of sellers sourcing from the U.S. decreased by 17%, while those sourcing from India saw a substantial 56% increase, indicating diversification in supply chains.
Below are the top sourcing countries for Amazon sellers:
| Supplier Countries | % of sellers |
|---|---|
| China | 71% |
| United States | 30% |
| India | 14% |
| Germany | 6% |
| Mexico | 5% |
| Japan | 5% |
| Vietnam | 5% |
| Italy | 4% |
| South Korea | 4% |
| Belgium | 4% |
| Other | 14% |
(Source: Jungle Scout Study)
How Sellers Price Their Products
Pricing strategy is critical on Amazon. The majority (61%) of Amazon businesses price their products between $16 and $50. Setting the right price involves balancing production costs, shipping fees, marketing expenses, competitor pricing, and perceived customer value. Many sellers adhere to a “rule of thirds”: one-third of the price covers product costs, one-third goes to Amazon fees, and the remaining third represents profit.
Here’s the distribution of product price ranges among sellers:
| % of Amazon Sellers | Pricing Range |
|---|---|
| 4% | Under $5 |
| 9% | $6-10 |
| 16% | $11-15 |
| 18% | $16-20 |
| 16% | $21-25 |
| 15% | $26-30 |
| 13% | $31-50 |
| 5% | $51-100 |
| 1% | $101+ |
| 3% | Product prices vary significantly |
(Source: Jungle Scout Study)
The Investment: What It Takes to Sell on Amazon
Success on Amazon doesn’t follow a single formula but generally requires investment in time, capital, and marketing.
Time
Time is a crucial resource. Encouragingly, about 74% of sellers manage to launch their Amazon business within six months.
Average time taken to start an Amazon business:
| Time Taken | % of sellers |
|---|---|
| Less than 6 weeks | 23% |
| 6 weeks to 3 months | 25% |
| 3-6 months | 26% |
| 6 months – 1 year | 19% |
| More than 1 year | 6% |
Once operational, most Amazon sellers and brands spend between 4 and 20 hours per week managing their business. Interestingly, there has been a 138% increase in sellers spending 4 hours or less per week, rising from 8% last year to 19% this year, possibly indicating increased efficiency or reliance on automation/outsourcing.
Average time spent on Amazon business each week:
| Time spent each week | % of Sellers |
|---|---|
| 4-10 hours | 31% |
| 11–20 hours | 21% |
| Fewer than 4 hours | 19% |
| 21-30 hours | 12% |
| 31-40 hours | 7% |
| 41-50 hours | 4% |
| 51-60 hours | 4% |
| More than 60 hours | 3% |
(Source: Jungle Scout Study)
Money
Starting an Amazon business doesn’t always require massive capital. Most businesses (64%) begin with less than $5,000 in upfront investment, and a quarter (25%) start with under $1,000.
| Money spent by sellers | % of sellers |
|---|---|
| $0 | 2% |
| $1-$500 | 14% |
| $501-$1000 | 9% |
| $1001-$2500 | 16% |
| $2501-$5000 | 23% |
| $5001-$10,000 | 18% |
| More than $10,000 | 17% |
Many sellers see a relatively quick return on this investment. Over one-third (35%) achieve profitability within the first six months of operation.
Time taken to turn a profit for Amazon sellers:
| Time taken to turn a profit | % of sellers |
|---|---|
| Fewer than 3 months | 22% |
| 3-6 months | 16% |
| 6 months – 1 year | 20% |
| 1-2 years | 11% |
| More than 2 years | 2% |
| Not Defined | 7% |
| Not profitable | 22% |
(Source: Jungle Scout Study)
Marketing Investments
Advertising is a near-universal activity for Amazon sellers, with 84% investing in promoting their products either on or off the platform. For sellers and SMBs, advertising directly on e-commerce platforms like Amazon (via PPC) is the preferred method (58%). Enterprise brands and larger retailers, however, show a stronger inclination towards paid search advertising (e.g., Google Ads), with 64% utilizing these channels.
Top advertising channels for Amazon businesses:
| Advertising Channels | Sellers and SMB’s | Enterprise Brand and Retailers |
|---|---|---|
| Search engines/paid search | 34% | 64% |
| Social media | 42% | 48% |
| eCommerce platforms | 58% | 50% |
| Traditional media | 7% | 12% |
| None of the above | 17% | 4% |
(Source: Jungle Scout Study)
Social Media Advertisements
Social media platforms are increasingly crucial for e-commerce promotion. In 2024, 44% of all Amazon businesses report advertising on social channels. Facebook remains the dominant platform, preferred by 71% of sellers who use social media advertising. TikTok and YouTube ads are also popular, especially among enterprise brands.
Most preferred social media advertising platforms:
| Social Media Platform | % of Sellers using it | % of Enterprise brands and retailers using it |
|---|---|---|
| Facebook ads | 71% | 80% |
| Instagram ads | 62% | 46% |
| Pinterest ads | 17% | 27% |
| TikTok ads | 32% | 52% |
| YouTube ads | 30% | 52% |
| Snapchat ads | 6% | 18% |
| LinkedIn ads | 11% | 34% |
| Branded YouTube Channel | 11% | 36% |
Regarding ad spend, the majority (68%) of sellers allocate $0-$2500 per month towards advertising efforts across all channels.
Average monthly advertising spending by sellers:
| Average Spending | % of Sellers |
|---|---|
| Less than $500 | 47% |
| $501-2500 | 21% |
| $2,501-$5,000 | 9% |
| $5,001-$7,500 | 6% |
| $7,501-$10,000 | 4% |
| $10,001-$25,000 | 3% |
| $25,001-$50,000 | 1% |
| $50,001-$100,000 | 1% |
| $100,001-$250,000 | 1% |
(Source: Jungle Scout Study)
Amazon Sellers and AI Trends
Artificial intelligence (AI) is rapidly becoming integrated into e-commerce operations. Amazon sellers are increasingly leveraging AI tools to streamline tasks, enhance product listings, and refine marketing strategies. In 2024, nearly half (48%) of all Amazon sellers report using AI technologies to manage aspects of their e-commerce business.
The most common application of AI is for writing and optimizing product listings (34%), followed by creating marketing and social media content (14%).
How Amazon sellers utilize AI technology:
| How Sellers use AI technology | % of Amazon Sellers |
|---|---|
| Writing and optimizing listings | 34% |
| Creating marketing and social media content | 14% |
| Keyword and SEO research | 7% |
| Product research | 6% |
| Customer service | 6% |
| Product images | 6% |
| Advertising management and optimization | 5% |
| Personalized marketing tactics and campaigns | 3% |
| Data collection and analysis | 3% |
| Business planning and reporting | 3% |
| Brand management and protection | 2% |
| Market and competitor research | 2% |
| Logistics optimization and monitoring | 2% |
| Inventory management | 2% |
| Dynamic pricing and optimization | 2% |
(Source: Jungle Scout Study)
Amazon Prime Day: A Sales Phenomenon Analyzed
Amazon Prime Day has evolved into a major global shopping event, generating massive sales and engagement. The 2024 event, held on July 16-17, surpassed all previous records, becoming the largest Prime Day to date.
In the US alone, Amazon Prime Day 2024 generated over $14.2 billion in sales, marking an 11% increase compared to the $12.7 billion recorded in 2023. This continues a trend of significant year-over-year growth.
 Graph depicting the significant year-over-year growth of Amazon Prime Day US sales from 2015 to 2024.
Here’s a look at the historical sales growth of Prime Day in the US:
| Year | Prime Day Sales (in billions USD) |
|---|---|
| 2024 | 14.2 |
| 2023 | 12.9 |
| 2022 | 12.0 |
| 2021 | 11.2 |
| 2020 | 10.4 |
| 2019 | 7.16 |
| 2018 | 4.19 |
| 2017 | 2.41 |
| 2016 | 1.52 |
| 2015 | 0.9 |
(Source: Statista)
Globally, shoppers purchased over 300 million items during the Prime Day 2024 event. Popular products included electronics like Amazon Fire TV Sticks, alongside health and wellness items such as Premier Protein Shakes and Liquid IV Packets. High-demand categories also included apparel, home goods, and household essentials.
Amazon reported having over 200 million Prime members worldwide participating actively. In regions like India, Prime member participation saw a 24% increase compared to the previous year, highlighting the event’s growing global reach and importance for sellers participating in the deals.
(Source: Amazon, Jungle Scout)


